How to Setting Nginx Request Time Log Milliseconds in RHEL 7
 |
| How to Setting Nginx Request Time Log Milliseconds in RHEL 7 |
How to Setting Nginx Request Time Log Milliseconds in RHEL 7 - In the realm of web server optimization and performance monitoring, the meticulous tracking of 'Nginx Request Time Log in Milliseconds' stands out as a critical metric.
This granular insight into the time taken for each request in milliseconds becomes a key component in assessing server efficiency, diagnosing latency issues, and fine-tuning configurations for optimal performance.
Benefit
By enabling request time in logs you will find it easier when there is a problem with your application, and you can analyze the access log and see how long it takes to request data between servers.
Preparation
Before doing this configuration, make sure you have installed the Nginx itself, and make sure you first backup the original Nginx configuration by:
# cp /etc/nginx/nginx.conf /etc/nginx/nginx/conf.ori
Once the backup is free, you can edit the configuration.
Configure
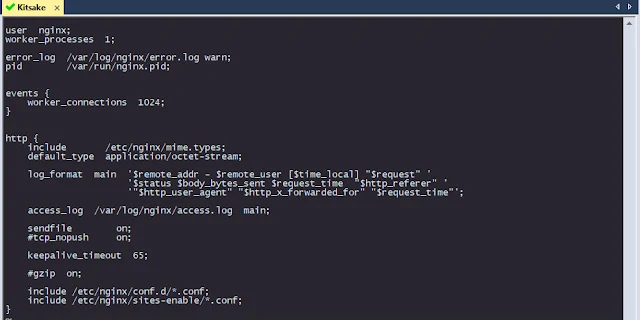
To create an access log with request time, you have to set up the configuration of the nginx service itself. Here the default settings for nginx are usually in / etc / nginx / with the file name nginx.conf. You can edit directly with vi.
# vi /etc/nginx/nginx.conf
}
  log_format  main  '$remote_addr - $remote_user [$time_local] "$request" '
          '$status $body_bytes_sent $request_time "$http_referer" '
           '"$http_user_agent" "$http_x_forwarded_for" "$request_time"';
}
save & exit
 |
| configure of nginx request time |
After you configure it in nginx.conf, try adding main at the end of the configuration of the access log in your vhost.
# vi /etc/nginx/sites-enable/nginx-kitsake.conf]
server {
    listen  1111;
    root    "/app/kitsake/public";
    server_name kitsake;
    index index.php index.html index.htm;
    try_files $uri $uri/ /index.php?$args;
    access_log /var/log/nginx/kitskae-access.log main;
    error_log /var/log/nginx/kitsake-error.log;
}
save & exit
 |
| configure of vhost request time |
After you have finished configuring it all, try to apply it by restarting the Nginx service.
# nginx -t
# systemctl restart nginx
Trying
Finally, you can test whether the configuration is running perfectly. You can hit it by hitting your server ip and application port, and you can also monitor the access log on your server to see the results:
 |
| trying to hit manual webserver with request time |
Conclusion
In conclusion, optimizing and monitoring the performance of a web server like Nginx involves meticulous tracking of request time in milliseconds. This granular insight not only aids in assessing server efficiency but also plays a crucial role in diagnosing latency issues and fine-tuning configurations for optimal performance.
By enabling request time logging in Nginx, administrators gain a valuable tool for troubleshooting application problems, analyzing access logs to pinpoint data request durations between servers, and ultimately ensuring smooth and efficient operation of their web infrastructure.
With careful configuration and testing, administrators can leverage this capability to enhance the overall reliability and performance of their Nginx-based systems.


Post a Comment for "How to Setting Nginx Request Time Log Milliseconds in RHEL 7"
Post a Comment